AI Influence on
US Workforce Salaries

The rise of artificial intelligence (AI) is reshaping the American job market. Our survey titled AI Influence on U.S. Workforce Salaries indicates that AI jobs are on the rise and come with attractive compensation packages. Interestingly, AI's impact spreads beyond the tech space, influencing pay gaps between tech and non-tech roles, as well as between jobs directly involving AI and those that don't.
This article is a detailed summary of our findings on AI's role in transforming job markets and shaping the financial aspects of various professions. Let's unpack the implications of artificial intelligence for the U.S. workforce.
Key Findings
The pay gap between tech jobs and other occupations has widened by 36% due to AI.
Connecticut has the highest average AI wage with over $176K a year, while Tennessee has the lowest with $84K.
Guam has the best AI salaries compared to all occupations, coming in at 167% more than other occupations in the state.
By 2024, there are potentially be more than 131,000 AI-related jobs in the computer science market.
Methodology
Data for AI-Related Occupations:
We gathered data from eight of the most popular job posting platforms in 2023. Our approach involved using a list of keywords like Artificial Intelligence, AI, Machine Learning, Deep Learning, Computer Vision, and Natural Language Processing to create a list of AI-related jobs.
We collected various details from each job posting, including:
- Job titles
- Salary
- Location
- Level
Calculation Interpretation:
- % more that AI workers earn than all occupations: these figures are calculated by taking the average total collected salary of AI-related occupations and comparing it to the average salary of other occupations by state
- Pay Gap: this is calculated by taking the sum of the difference between % more that AI and Tech workers earn than all occupations and % more that tech workers earn than all occupations, and dividing by the total number of states.
In terms of future trend prediction, we apply a moving average with 95% confidence interval based on the past 10 years of historical data that were collected from AI Index Report.
Data for Normal Job:
We examined the Bureau of Labor Statistics website to get the data in terms of locations, mean wage, occupations as well as their categories.
Data for Tech Job:
Similar to data for normal jobs, we split into a different category by only examining jobs under the Computer and Mathematical Occupations category.
SECTION 1
AI Jobs Salary
AI-related job salary overview
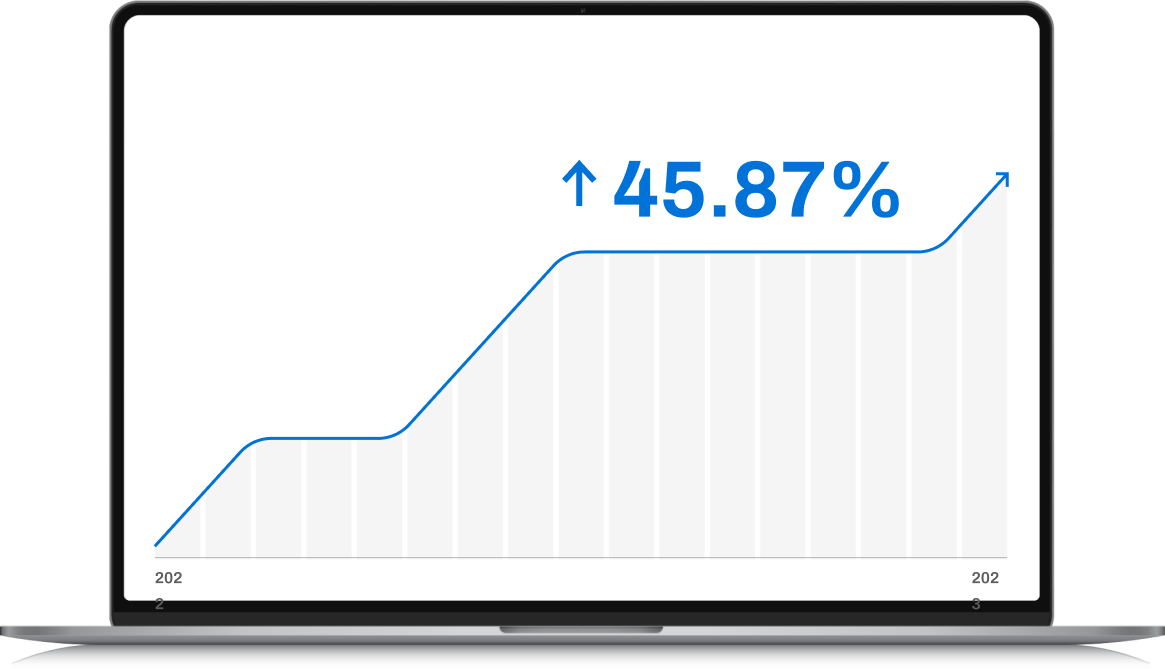
In just one year, from 2022 to 2023, computer science salaries in the United States witnessed a substantial surge, with an impressive average increase of 45.87%.
This growth, which is directly attributed to the booming demand for professionals in AI-related roles, shows the profound influence of artificial intelligence on workforce compensation.
AI-related Job Salary Compared to Other Occupations
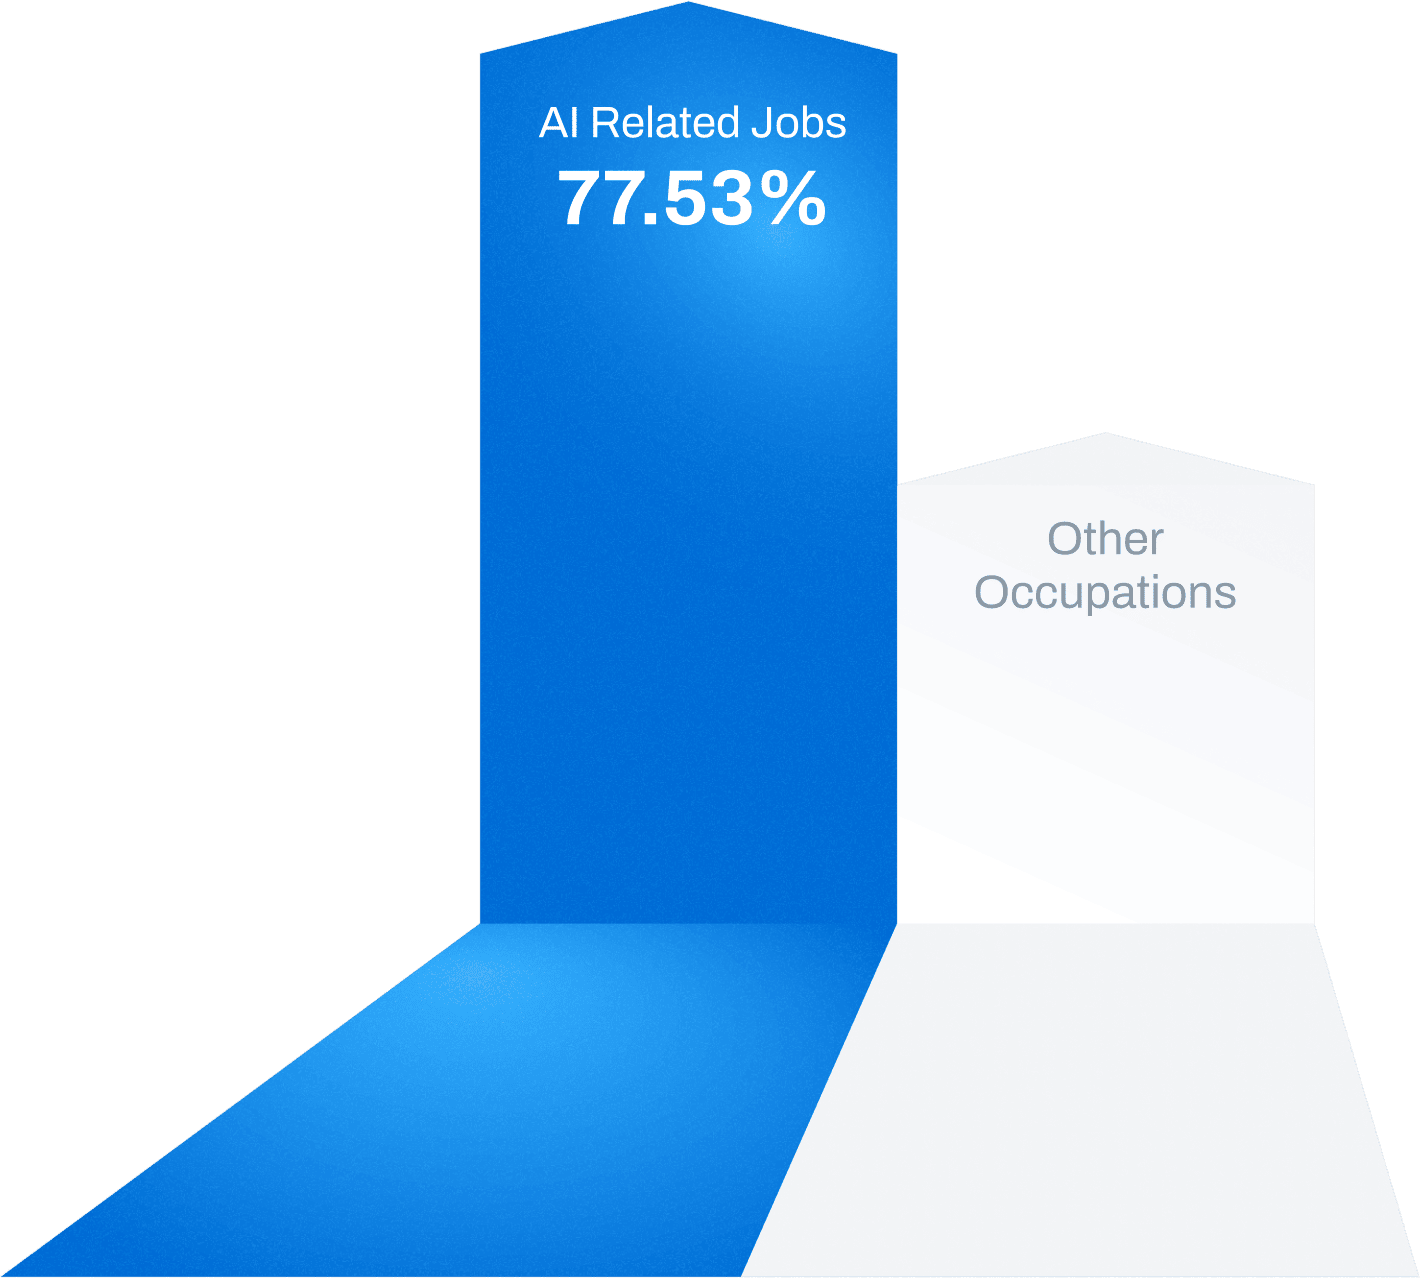
AI-related jobs offer 77.53% higher pay than other occupations
This salary disparity is most noticeable at the entry-level, where AI-related jobs boast an impressive 128% higher compensation than their non-AI counterparts. Such a considerable difference highlights the strong demand and value placed on AI skills.
Breaking down the salary levels across different experience levels, the table below shows the salary gap between AI and non-AI jobs.
| Level | Other Occupations |
|---|---|
| Entry | 128.23% |
| Midlevel | 55.77% |
| Senior | 48.61% |
Highest Paying Jobs in Every State
When it comes to the highest-paying AI jobs across the United States, Arizona is the state with the most impressive salaries. Although it beats states like Wyoming, these states still offer significantly high salaries for AI-related roles.
- Arizona offers the highest AI job pay up to $450K a year for the System AI Architect position.
- Among the 55 states, Wyoming offers the lowest salary for its best-paying AI job, which is the position of Software Architect - Cloud AI/ML, with an annual income of nearly $192K.
- 22 out of 50 states' best-paying AI jobs are in Machine Learning. This emphasizes the critical role that Machine Learning expertise plays in today's AI job market
We've tabulated these state-specific insights below.
Average Salary
- 100k
- $200k
- $300k
- 400k $500k
| State | Position | Average Salary |
|---|
State-by-state AI jobs salary comparison
When analyzing AI worker salaries across the United States, our data revealed distinct regional variations.
Connecticut, California, South Carolina, Louisiana, and Minnesota have emerged as the top-paying states for AI professionals. Connecticut has the highest average AI wage with over $176k a year.
On the other hand, Tennessee reports the lowest AI worker wages in the U.S., averaging $84,190 annually.
However, even with this seemingly lower figure, the pay is still greater than the average wage in 39 states for other occupations.
Guam has the best AI salaries compared to all occupations, coming in at 167% more than other occupations in the state. On the other hand Maryland has the lowest AI salaries compared to other occupations, with AI jobs earning only 3.3% more.
AI jobs in 10 states make over 100% more than the average salary in those states. This signals the financial attractiveness of AI jobs, even in states where the overall salary landscape may differ.
The following table gives a numeric contrast of the average salaries by state.
Average Salary by States
% more that AI workers earn than all occupations
- 0%
- 40%
- 80%
- 120%
- 160% 200%
| State | Average salary for AI-Related jobs |
Average salary for other occupations |
% more that AI workers earn than all occupations |
|---|
AI Impact on Tech vs. Non-Tech Pay Gap
Artificial intelligence (AI) drastically impacts how much tech and non-tech jobs pay across the U.S. On a national average, AI has widened the pay gap between tech and non-tech jobs by 36%. This indicates a significant shift in compensation dynamics driven by the integration of AI technologies in various industries. Regional disparities are clearer in states like Alaska and the District of Columbia: These regions stand out with a 64% AI impact in the pay gap between tech and non-tech roles. In contrast, California, a tech hub, demonstrates resilience in its pay gap, with AI affecting it the least. The gap remains at a modest 5%.
Average Salary by States
% AI Impact
- 0%
- 15%
- 30%
- 45%
- 60% 75%
| State | % more that tech worker earn than all occupations (excluding AI jobs) |
% more that tech workers earn than all occupations (including AI jobs) |
% AI Impact |
|---|
SECTION 2
AI Jobs number increasing
In 2023, 30.3% of computer science jobs are AI-related.
AI-related job opportunities are on the rise, with a notable increase in their prevalence.
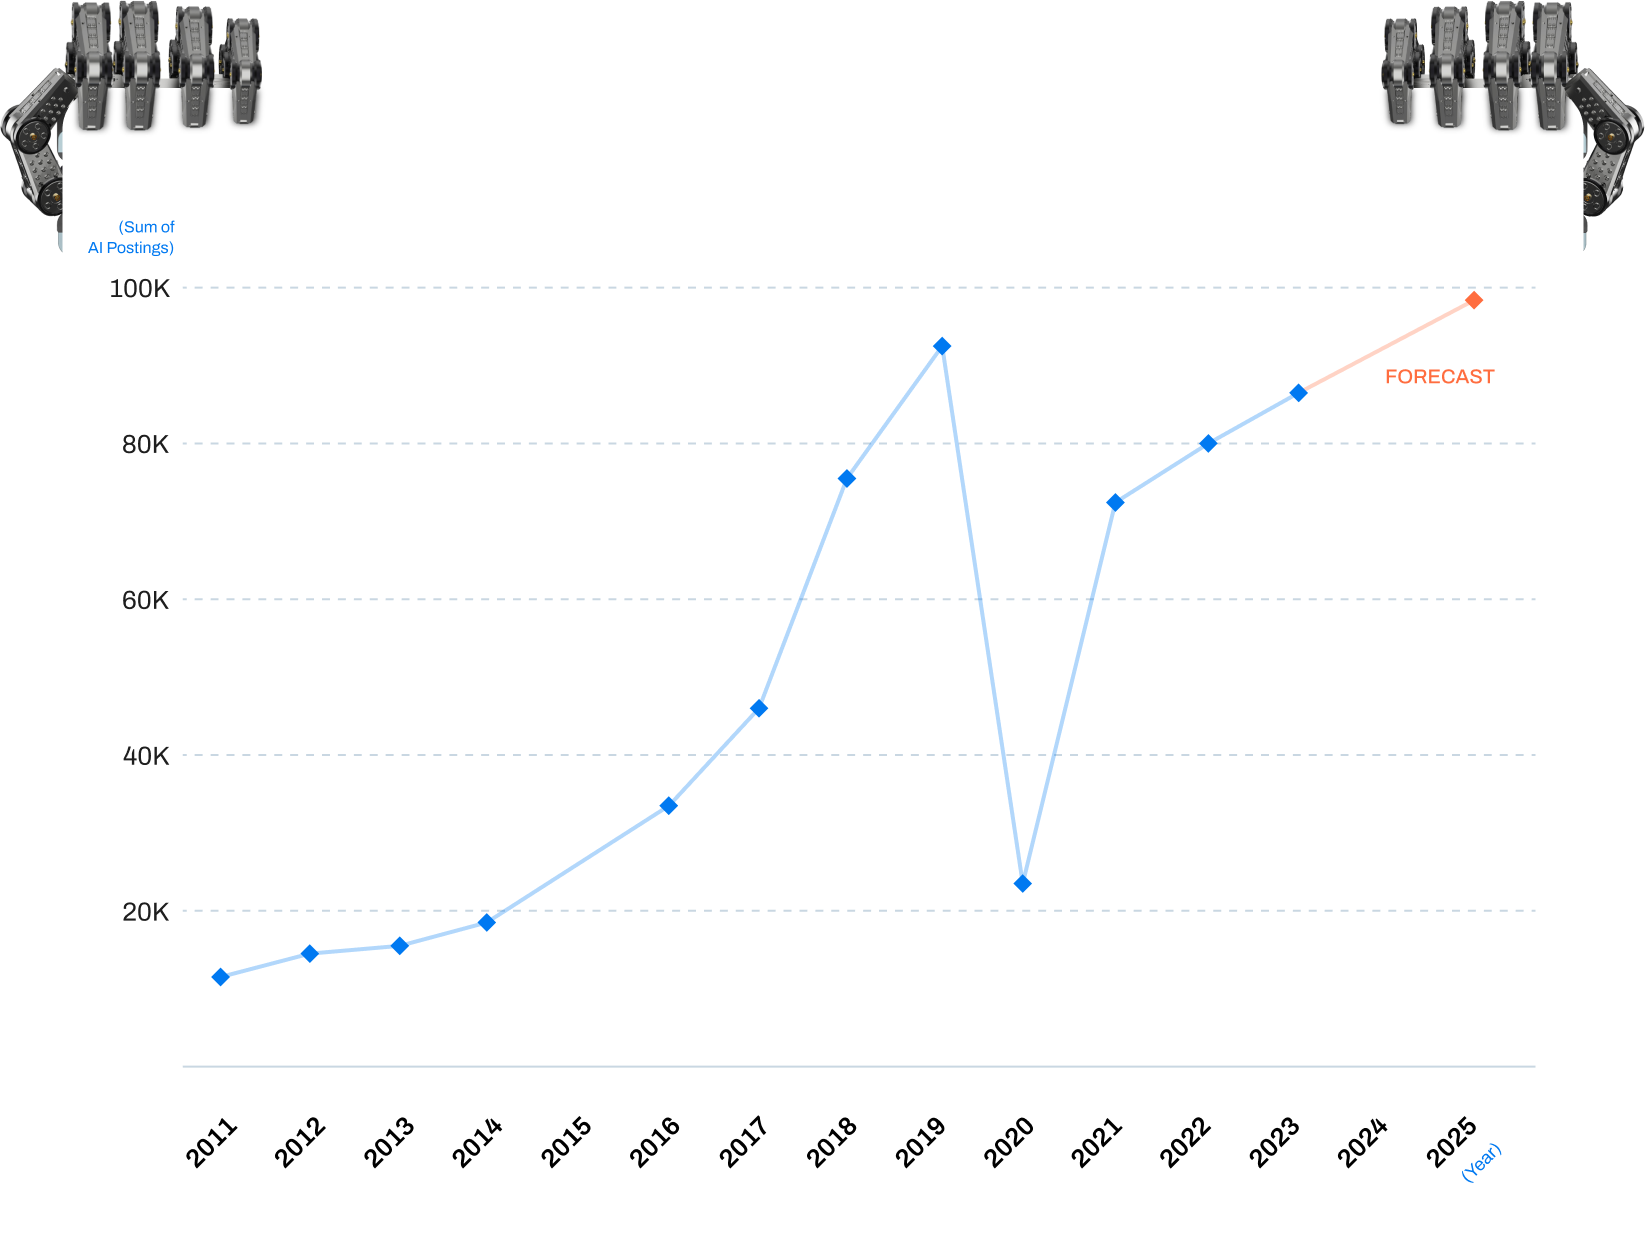
Between 2011 and 2020, there has been a noteworthy increase in AI-related job postings. In 2011, there were 12,237 such postings, and by 2020, this number grew to 23,368. This decade-long comparison reflects the escalating demand for professionals with expertise in artificial intelligence.
According to our forecast, we project that by 2024, there will be potentially more than 131,000 AI-related jobs for the computer science market. This substantial number indicates the rapid growth and demand for AI expertise in the job market.
The table below summarizes the increase in AI-related job postings from 2011 to 2020. To further visualize these numbers, we plotted a graph. This graph analyzes the sum of AI postings from 2011 to 2023 and predicts the sum of these postings through to the year 2026. It also indicates the lower and upper confidence bounds for the predicted values.
| Year | Sum of AI Postings |
|---|---|
| 2011 | 12,237 |
| 2012 | 14,944 |
| 2013 | 16,223 |
| 2014 | 19,227 |
| 2015 | 27,267 |
| 2016 | 33,823 |
| 2017 | 45,804 |
| 2018 | 76,016 |
| 2019 | 93,361 |
| 2020 | 23,368 |
| 2021 | 74,615 |
| 2022 | 80,842 |
| 2023 | 87,071 |
| 2024 | 93,298 |
| 2025 | 99,526 |
| 2026 | 105,753 |